
Sales managers navigate the dynamic sales terrain using the reports and dashboards feature of Salesforce, powerful tools providing actionable insights. Reports distill vast data into digestible information, while dashboards clarify crucial metrics. In our exploration, we’ll unveil the significance of reports & dashboard for sales managers with the vision to drive success.
As we delve into the transformative impact of Reports and Dashboards, envision a landscape where every data point contributes to a clearer understanding of your sales pipeline. Salesforce empowers sales managers to navigate precisely, deciphering individual sales rep performance and identifying emerging trends. Let’s unravel this analytical prowess, illuminating the path for sales managers to harness the full potential of Salesforce Reports and Dashboards.
Why do Sales Managers Require Reports & Dashboards?
In the dynamic realm of sales management, Salesforce Reports and Dashboards emerge as vital assets for sales managers. Here’s a closer look at the pivotal role these tools play in shaping effective sales strategies:
- Performance Monitoring: Track team and individual metrics for insights.
- Data-Driven Decision-Making: Utilize visual data for informed strategic planning.
- Pipeline Visibility: Assess ongoing deals, forecast sales, and allocate resources.
- Goal Tracking: Align the team with organizational targets for focused efforts.
- Forecasting Accuracy: Improve accuracy with historical data and predictive analytics.
- Collaboration and Coaching: Enhance teamwork, and coach based on performance data.
- Identifying Trends: Analyze customer behavior, market trends, and product performance.
- Efficiency Improvement: Streamline reporting processes, save time, and focus on strategic initiatives.
How to Create Effective Reports
Sales, a pivotal organizational element, rely on well-organized data for informed decisions. Customer Relationship Management (CRM) systems provide robust support for sales teams. Trailhead, Salesforce’s educational platform, offers insights into report and dashboard creation. Effectively utilizing Salesforce reports and dashboards for sales managers necessitates data gathering, metric selection, and an in-depth understanding of your audience. Sales operations reports aim to follow the following questions:
- How does your revenue compare to expenses within a specific timeframe?
- What is the projected number of sales by month/quarter/year, and what revenue is anticipated for the upcoming period?
- Are your sales goals being achieved, and what is the month-to-month, quarter-to-quarter, or year-to-year performance of your sales team?
- What percentage of sales efforts result in actual sales?
- How much time does each sales representative spend in every phase of the sales process?
- What are the top-performing products and services, and which ones fall short of expectations?
- What are the key challenges in the overall sales process and the primary areas for potential growth?
Data Required for Salesforce Sales Reports
By organizing information systematically, you can identify your clients’ challenges and tailor your communication strategies accordingly. It’s crucial to gather both business and personal details about your customers for a more holistic perspective. Essential data to collect includes:
- Company Data:
- Company Location
- Company Website
- Company LinkedIn URL
- Industry
- Personal Data
- First name
- Last name
- Job title
- Number of LinkedIn connections
- LinkedIn URL or social networking URL (Facebook, Twitter, Instagram)
- Business email
- Personal email
- Phone number
You have the opportunity to enhance and categorize this data by incorporating additional relevant information and further segmenting it based on related facts, such as:
- Social media group membership
- Account subscriptions
- Person’s background: working experience
- Products/services used
- Technologies/tools used
- Events visited
- Contact’s date of creation
- First/Last date of a LinkedIn message sent
- First/Last date of the email sent
- Campaign name
- Next follow-up date
- Current outreach status
Certainly, when compiling comprehensive sales reports, the data collection scope can extend beyond the suggested concepts, tailoring it to the unique specifics of your business. Broadly, you have the flexibility to segment client information based on various criteria, allowing for a nuanced and detailed analysis, like:
- ICP (Ideal Customer Profile) and buyer personas
- Industries
- Company size
- Lead sources
- Behavioral factors and interaction history
Categorize leads, pinpoint lost leads, and reasons to devise win-back strategies. Once you’ve selected your data and grouping criteria, assign scores based on activities that are highly likely to result in a purchase, such as:
- Emails open rate
- Link open rate
- Reply rate
- Number of replies by category
- Bounce rate
- Landing pages visits
- Site traffic
- Forms Completion
- Lead magnets download
- Number of chat interactions
- Pop-up clicks
- Number of video watches
Organize Data for Monitoring & Evaluation in Reports within the Salesforce
Step 1: Select a Reporting Period
To ensure accuracy in your report, opt for a timeframe – whether it’s weekly, monthly, quarterly, or yearly. This decision will unveil insights into sales cycles, customer behaviors, and marketing results, emphasizing sales trends or successful product launches.
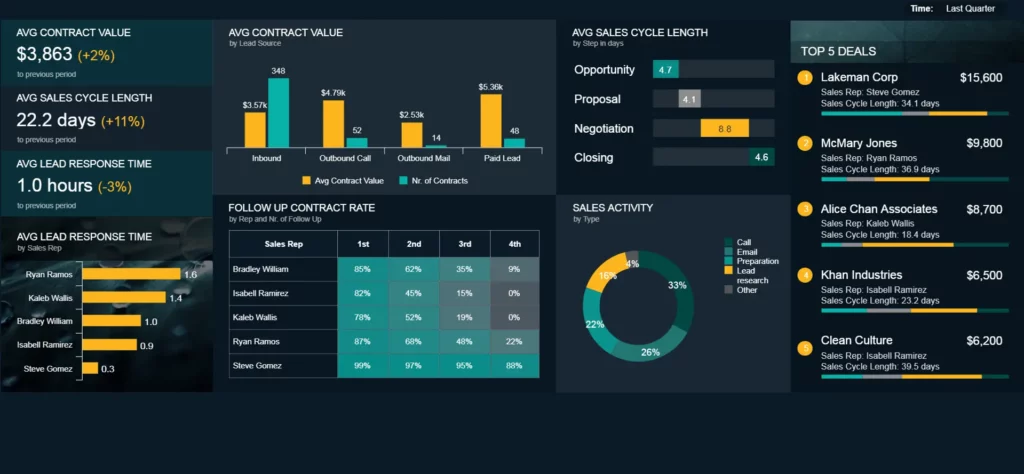
Step 2: Choose impactful visuals for your reports
Crafting effective sales reports requires clarity and actionable data presentation. Explore diverse visualization options, from bar graphs for product performance to pie charts indicating individual product contributions. Visual appeal is essential, but coherence and completeness are equally crucial. Seek inspiration from top Salesforce dashboard examples online or consult a Salesforce expert for valuable insights.
Step 3: Ensure CRM Data Integrity
To generate precise reports, it’s essential to have clean and accurate data. CRM tools, such as Salesforce, play a crucial role in maintaining consistent and up-to-date client information. Regularly cleaning your data enhances the effectiveness of analyzing key details. For instance, Salesforce’s data quality dashboards can identify gaps in contact or industry data.
Step 4: Find Essential Metrics to Monitor
Typically, businesses should keep a close eye on various key indicators, activities, and statistics, including:
- Marketing and Sales Leads:
- Marketing Qualified Leads (MQL) and Sales Qualified Leads (SQL)
- Leads categorized by Stats, Type, Stage, Source, and Period
- Lead conversion rate
- MQL to SQL (Sales Qualified Lead) Conversion
- Sales Activities:
- The volume of calls, emails, appointments, and meetings
- Activities logged by sales reps
- Number of scheduled demos
- Time spent in each pipeline stage
- Deal Metrics:
- Top sales reps based on revenue or performance
- Percentage of closed deals
- Closed deals categorized by Type
- Top deals and number of lost deals
- Deals Won vs. Deals Lost by Owner
- Deals Closed by Quarter/Month for This Year & Last Year Against Quota
- Deals Closed by Region/Department/Territory for This Year & Last YearAgainst Quota
- Progress towards revenue goals for the period
- Proposal to Close Conversion
- Lead Insights:
- Lead response types
- Number of Active & Closed Leads, Opportunities, and Deals
- Lead status by owner
- Stale opportunities and those stuck in a stage for 60 days
- Reasons for unqualified leads
- Campaign Analysis:
- Top campaigns and campaigns ranked by ROI
- Weekly pipeline generation and source-wise breakdown
Our Recommendation for Salesforce Reports for Sales Managers
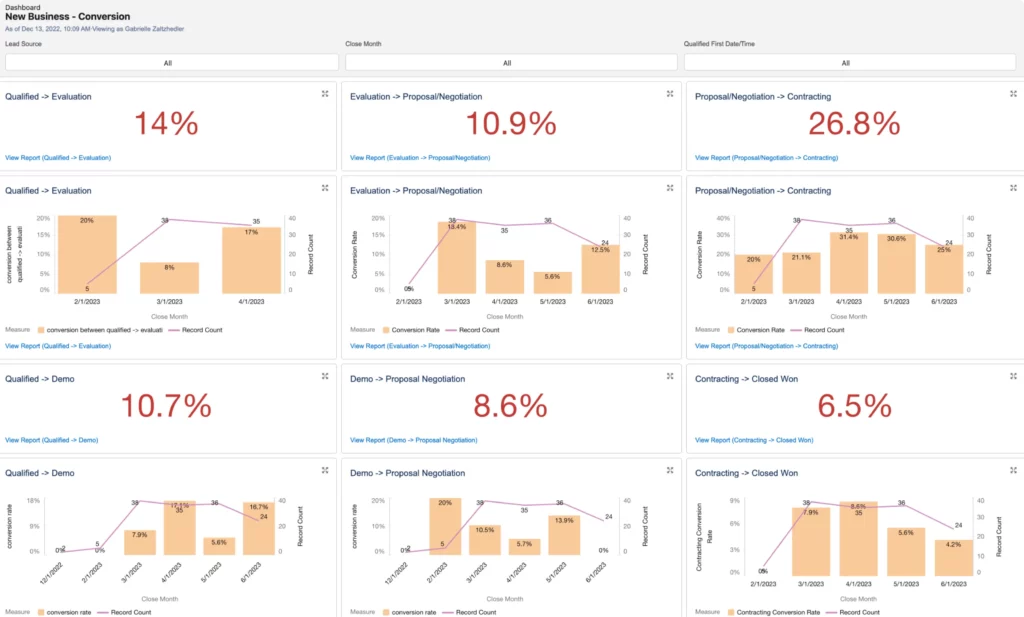
The Lead Conversion Report
This report focuses on tracking the effectiveness of lead conversion throughout the sales process. It provides insights into the lead journey, helping sales managers optimize strategies for better conversion rates. The key metrics to be tracked are:
Key Metrics Tracked
- Number of Marketing Qualified Leads (MQL) and Sales Qualified Leads (SQL)
- Conversion rates at different stages of the sales funnel
- Average time taken to convert a lead
- Reasons for unqualified leads
Questions Answered
- How effectively are Marketing Qualified Leads converting into Sales Qualified Leads?
- Are there specific stages where leads are dropping off or getting stuck?
- What is the average time it takes to convert a lead from initial contact to a closed deal?
- What are the common reasons for leads being deemed unqualified?
- How well are different marketing channels contributing to lead conversion?
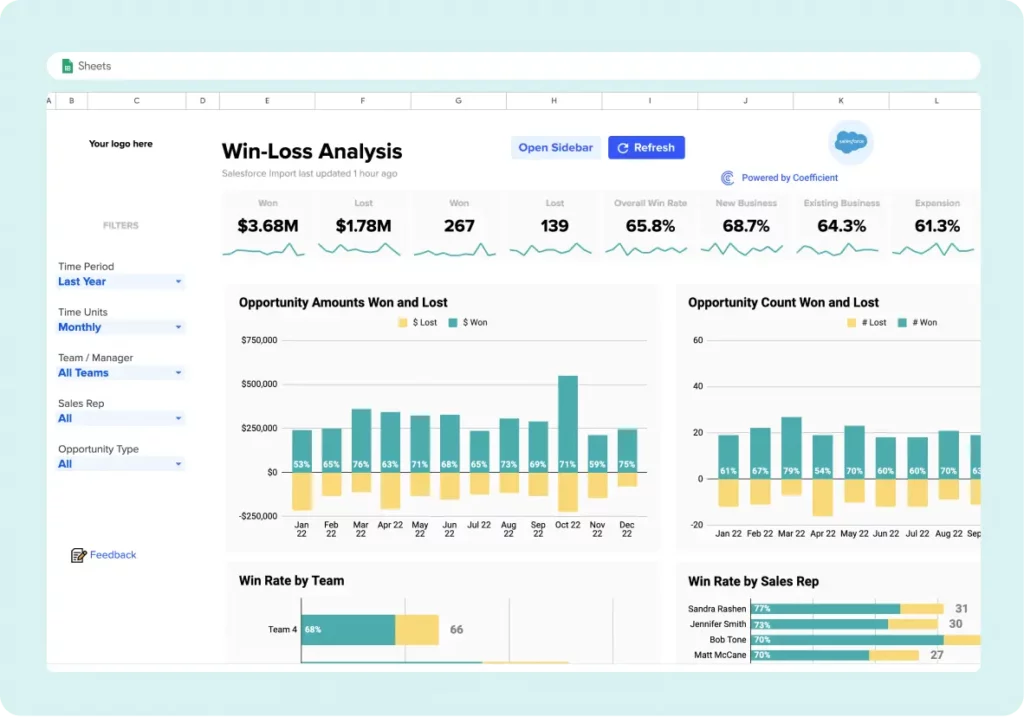
The Opportunity Win-Loss Report
This report provides a detailed analysis of opportunities, focusing on the factors contributing to both won and lost deals. It helps sales managers identify patterns, strengths, and areas for improvement.
Key Metrics Tracked
- Win rates for different products or services
- Reasons for winning deals
- Reasons for losing deals
- Average deal size for won opportunities
- Time taken to close won opportunities
Questions Addressed
- Which products or services have the highest win rates?
- What are the common reasons behind winning deals?
- What are the common reasons behind losing deals?
- What is the average deal size for won opportunities?
- How does the time taken to close a deal impact the win rate?
The Sales Rep Performance Report
This report evaluates the performance of individual sales representatives, providing a comprehensive view of their contributions to the sales team.
Key Metrics Tracked
- Number of closed deals
- Revenue generated
- Average deal size
- Win rates
- Activity levels (calls, emails, meetings)
Questions Addressed
- Who are the top-performing sales representatives based on closed deals and revenue generated?
- What is the average deal size achieved by each sales representative?
- What are the win rates for individual sales reps?
- How active are each sales rep in terms of calls, emails, and meetings?
- Are there specific areas where certain sales reps excel or need improvement?
Growbiz can help you
If you wish to simplify the reporting experience, entrust all Salesforce-related challenges to our experts at Growbiz Solutions. Here’s how we can support the customization of Salesforce reports and dashboards at Growbiz Solutions:
- Our consultants can assist in structuring and categorizing data within Salesforce, ensuring logical organization and easy accessibility for reporting.
- Our professionals can seamlessly integrate data to generate comprehensive reports pulling data from multiple sources.
- We can create custom reports tailored to unique metrics and KPIs relevant to the business.
- Our experts can construct interactive dashboards offering a visual representation of sales and marketing data, facilitating the interpretation of essential sales metrics and informed decision-making.
- To guarantee accuracy in reports and dashboards, our Salesforce consultants can implement data validation measures and conduct periodic data cleaning, preventing errors ensuring consistency, and much more.
If you still have questions about Salesforce reports and dashboards or need assistance with your Salesforce org, schedule a free CRM consulting call with Growbiz Solutions